Epidemiology of MS, prevalence, incidence and time to get proper diagnosis and disease modifying therapy

Dr Javier Carod Artal
Consultant neurologist, Raigmore Hospital, NHS Highland

MasterClass 2, 2018
1. Introduction
Multiple sclerosis (MS) is the commonest cause of neurological disability in young people. Quality of life, mood, cognition, and family and society financial burden is also significantly affected. MS is more common in Northern Europe and among Northern European ancestry people.
In order to get a full picture of MS burden in the Highlands, epidemiological studies including prevalence and incidence data, are needed. Accurate data may be helpful to take decisions about development of service and implementation of new services for MS as well as the need to establish the requirement for more staff in the MS service.
2. Objectives
The main purpose of this audit is to get updated data about prevalence and incidence of multiple sclerosis in the Highlands.
Time is brain, and delays in both MS diagnosis and delayed time to start disease modifying therapy (DMT) may be prognostic factors in the long-term. So, the secondary purpose of this audit will be to calculate time to diagnosis and DMT. Time between symptom onset and MS diagnosis will be evaluated in incident MS cases. Pattern of use of DMT is described.
3. Material and methods
3.1. Study design
For the MS prevalence study, a cross sectional observational study was carried out with the data available in 2016. For the MS incidence study, a prospective hospital-register based study was carried out over a 12 month period, from 1 January 2016 to 31 December 2016.
3.2. Study population
Study population was the population living in the Scottish Highlands and the catchment area that was the part of Highlands covered by NHS Highlands and Raigmore Hospital. Raigmore Hospital is the tertiary reference centre in the Highlands and covers most of areas in the Highlands including North (Wick, Thurso, Brora, Invergordon), Centre (Inverness, Avimore, Nairn, Fort Augustus, Fort William), and West Coast (Ullapool, Sky Isle).
However Argyll and Bute, the Outer Hebrides, and Mull Island are covered by Glasgow area (Queen Elizabeth hospital), and these patients are not usually referred to Raigmore Hospital; for this reason, the population from that area will not be included in the analysis.
For the purpose of analysing crude prevalence rate (mean number of MS cases per 100,000 inhabitants), it was considered only the total population covered by Raigmore Neurology Department and the NHS Highlands, and not the whole population of the Highlands. Around 250,000 highlander inhabitants are covered by NHS Highlands and will be included in the analysis. Approximately 20% of the Highlands’s population, which is localised in the Outer Hebrides and surrounding areas near Glasgow region, are followed up by Glasgow teams.
3.3. Ascertainment and recruitment method
Prevalence data was obtained mainly from the MS database at Raigmore Hospital. Incidence data was obtained from both, Scottish incidence MS register and list of recently diagnosed MS patients and clinical records. Diagnosis was verified by reviewing medical records.
3.3.1. Prevalence
Data sources used to ascertain cases included consultant neurologists, rehabilitation consultants, MS clinical nurse specialists and Raigmore Hospital MS database, hospital records and laboratory and pharmacy data.
There are three neurologists based on Raigmore (one working on full time and two working on part time), two neurorehabilitation consultants, a specialist doctor and two MS nurse specialists.
Prevalence data were used for case ascertainment of patients alive and resident in the study area on prevalence day (1 June 2016).
The Raigmore Hospital MS database is usually used by MS specialist nurses to register the whole MS population under the care of the MS service. The database has been used for clinical and assistance purposes for several years. Data included in the database are name, community health index number, date of birth, gender and year of diagnosis of MS patients, among other variables. This database was the first approach to estimate prevalence of MS in the Highlands. The database also included information about deceased MS patients and those MS patients who moved to/from other NHS areas for care in the last year.
3.3.2. Incidence
Incidence data was obtained from the Scottish MS register, and was compared with the list of new MS diagnoses at Raigmore hospital and the MS forms that MS nurses from Raigmore send annually to the Scottish MS Register. Each year, all new MS patients diagnosed at NHS Highlands are included in the MS register. Demographic data about new MS patients is available, and prospective data can be analysed.
The Scottish Multiple Sclerosis Register National Report 2017 (incidence data from 2016) was used as external source of data, and the MS Specialist Nurse Registry at Raigmore as the internal source of data; both sources of information were compared. No data is available at the moment regarding the small number of paediatric MS cases seen in children below the age of 16 years.
3.4. Data collection
Community health index (CHI) number was used to identify each new MS patient. The CHI is a code composed by ten digits, and the first six digits represent day, month and year of birth.
For the prevalence study, collected data included age, sex, area of residence, and also mortality data.
Collected data for incident new MS patients included date of birth, gender, symptom onset, time to first assessment at neurology clinic, time to diagnosis, first symptoms, type of DMT used in the first year, and previous history of a formal diagnosis as clinical isolated syndrome (CIS).
3.5. Inclusion criteria
The 2010 McDonald criteria for diagnosis of MS (Polman, 2011) were used for those incident patients diagnosed between 1 January and 31 December 2016.
3.6. Statistical methods
Crude prevalence and incidence rates for 2016 were calculated. Mortality rate was also calculated.
Prevalence rates and 95% confidence intervals (CI) were calculated assuming a Wilson distribution and standardised against the Scottish population (June 2017).
Cause-specific mortality rates are the number of deaths attributable to a specific disease in a given population over a given time period (usually expressed per 100,000 persons per year).
Case-fatality rate was calculated by dividing the number of deaths from a specified disease (MS) over a defined period of time by the number of individuals diagnosed with the disease during that time; the resulting ratio is then multiplied by 100 to yield a percentage.
The incidence rate is the number of new MS cases per population at risk in a given time period (2016). The Poisson 95% confidence interval was also calculated.
Quantitative variables were described using mean ± standard deviation; range and median was also calculated. ANOVA and t-tests were also performed to evaluate differences by sex, when needed.
4. Results
4.1. Prevalence of multiple sclerosis in the Highlands
In total, 745 MS patients were registered in the 2016 MS Raigmore Hospital database and were actively followed up at neurology and/or MS nurse specialist clinics in the area depending from NHS Highlands.
The database of deceased MS cases included 120 patients.
In addition, the third section of the database included data about 66 MS patients who moved away to other NHS trusts in the last year.
4.1.1. Prevalence analysis
Regarding the 745 MS patients registered in the Raigmore Hospital census, the 75.4% (562 cases) were females, and 24.5% (183) were males.
Male to female ratio was 1:3.07; sex ratio was 32.56 MS males per 100 MS females. As a reference, the sex ratio of the total population in UK in 2010 (males per 100 females) according to the UN statistics was 96.6.
The mean age of the population was 54.1 ± 14.1 years [range: 15-95 years]. There were no differences in the mean age by gender (male, mean age: 54.1 years; female, mean age 54.01 years).
Mean age at diagnosis was 45.45 ± 13.27 years [range: 14-84 years].
The mean number of years of evolution since diagnosis was 8.5 years ± 4.6 years [mean age: 1-18; median, 9 years].
Taking into account that 745 MS patients were detected and that the population covered by NHS Highlands is 250,000 inhabitants, then, the estimated crude prevalence rate for MS in the Highlands was 300 cases per 100,000 inhabitants (95% CI: 280 to 320).
4.1.2. Mortality
Mortality data was available for 120 MS patients. The 70.8% were females (85 cases), and the 29.1% were males. Regarding annual mortality rate, this was recorded as 7 death cases in 2014; 10 in 2015; 9 in 2016; and 6 cases in the whole 2017.
Mortality rate for the year 2016 and the censed MS population was 8 MS cases per 1000 MS patients.
Cause-specific mortality rate was 3.6 MS deaths per 100,000 population. If among a Highland population of 250,000 people, 9 people died of MS in 2016, the MS cause specific mortality would be as follows: 9 multiple sclerosis deaths/ 250,000 population * 100,000 or 3.6 MS deaths per 100,000 population.
Case fatality rate is calculated as number of deaths assigned to a specific disease (MS) during given year (2016) divided by the number of new cases of that disease reported during the same year (2016). Case-fatality rate for MS was 9/36 * 100 = 0.25 * 100 = 25%.
4.1.3. Changes in MS population
The mean number of MS patients who moved away yearly seems to be stable: 7 cases in 2014; 7 cases in 2015; 3 cases in 2016; and 4 cases in 2017.
4.2. Incidence of multiple sclerosis in the Highlands. Year 2016
4.2.1. Incidence data
The seventh national report from the Scottish Multiple Sclerosis Register (SMSR) published by Information Services Division was used as external reference.
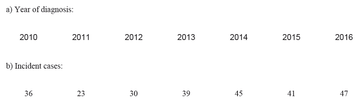
The report provides information on all patients who were diagnosed by a neurologist as having a confirmed diagnosis of MS from January 2010 to December 2016. During the year 2016, in Scotland 490 new patients having a confirmed diagnosis of MS were included in the MS Register. Approximately 10% (46 cases) were patients diagnosed in the whole Highlands. Thirty-six incident cases correspond to the Highland geographical area covered by NHS Highlands and will be analysed specifically.
In the whole Highlands region, the overall MS annual incidence per 100,000 population in the year 2016 was 11.6/100,000 inhabitants. However, the annual incidence rate in the NHS Highlands covered by Raigmore hospital was 14.4 per 100,000 inhabitants in the year 2016 (95% CI: 10.08-19.94). The mean age at diagnosis was 4.5 years old, and no differences were detected by gender.
Annual incidence was compared with the overall annual incidence per 100,000 population in Scotland which was 8.6. The highest incidence rate in Scotland was 18.56 and was recorded in Orkney and the lowest incidence rate was 6.14 in NHS Borders.
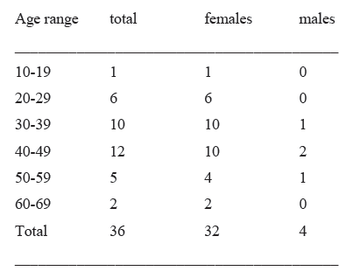
The age-specific distribution of the number of new cases by total population in 2016 in NHS Highlands was:
The number of people with a new diagnosis of MS in the Highlands from 2010 to 2016, reported by NHS Highlands was:
4.2.2. Demographic and clinical data of incident cases
Thirty-six incident new MS cases were registered in 2016 in NHS Highlands. They included 32 females (88.8%) and 4 males (11.1%). Mean age was 40.47 ±12.14 years [range: 15-67 years].
Initial symptoms/syndrome were: poor balance and gait ataxia, 1 case (2.7%); fatigue and poor balance, 1 case (2.7%); hemisensory syndrome, 2 cases (5.5%); lower limb weakness, 9 cases (25%); optic neuritis, 7 cases (19.4%); and sensory symptoms, 16 cases (44.4%).
4.2.3. Time to diagnosis
Time to diagnose was calculated in months. Mean period of time between first symptoms onset and assessment at neurology clinic was 28.3 ± 44.4 months [range: 1- 192 months; median: 9 months]. Mean period of time between first assessment a neurology clinic and diagnosis was 10.47 ±13.7 months [range: 1-49 months; median: 4 months].
Finally, the mean period of time from symptoms onset to diagnosis of multiple sclerosis was 38.8 ± 43.2 months [range: 2-193 months; median: 22 months].
A significant correlation (Spearman coefficient 0.34; p=0.04) between age and time to diagnosis was observed. No significant differences were observed in time “initial symptoms-to-diagnosis” by gender; however there was a trend to a shorter period of time to diagnosis in females (36.5 vs 54.2 months).
4.2.4. Use of MDTs
Nineteen patients (52.8%) were taking modifying disease therapies (MDTs). Most commonly used MDTs were: tecfidera, 9 cases (25%); copaxone, 4 cases (11.1%); plegridy, 3 cases (8.3%); tysabri, 1 case (2.7%); lemtrada, 1 case (2.7%); rebif, 1case (2.7%). One third patients on tecfidera (3 patients) stopped medication due to tolerability issues during the follow up.
The 47.2% of MS incident patients (17/36) were not taking any MDT. Reasons for not taking MDTs were: not keen to use traditional pharmacological therapy, 4 cases (23.5%); progressive MS in absence of identified relapses, 4 cases (17.6%); planning or thinking in pregnancy, 3 cases (17.6%); mild MS symptoms, 3 cases (17.6%); cancer, 1 cases (5.8%); interested only in treating sensory symptoms, 1 case (5.8%); waiting list/ locum assessments, 1 case (5.8%).
5. Additional epidemiological information from Western Islands
Additional epidemiological information was requested from the MS nurse responsible for the care of MS patients in the Western Islands and is summarised here. This data was received when finalising the draft of this paper.
A total number of 87 patients with MS are located on the Western Islands. The MS case load has fluctuated from 86 to 90. These are all the patients coded with a definitive diagnosis of multiple sclerosis and two with diagnosis of CIS. Thirteen patients were deceased over the past 5 years, and 4 MS patients have relocated off the islands. The prevalence rate in the Western Islands was 1:307, and the population covered is 26,500. There were 6 newly diagnosed patients in the last 12 months.
6. Discussion and further lines of research based on prospective studies
Historical analytic comparison was done with historical prevalence data of MS, and an increase in the number of MS cases has been seen in comparison with previous studies performed in other Scottish geographical settings in the previous decades (see table 1). In comparison with Orkney’s estimated prevalence in the 1960s, Highlands’s MS
prevalence in 2016 was three times higher.
The 2016 Highland’s prevalence data is comparable to prevalence rate found in 2009 in Shetland (305 cases per 100,000), and higher than the Aberdeen prevalence rate (237 per 100,000 inhabitants), and slowly lower than the reported prevalence data in Orkney for 2009 (421 per 100,000) (Visser, 2012).
As a note, the prevalence of MS recorded in the General Practice Research database (GPRD) increased by about 2.4% per year reaching 285.8 per 100,000 in women and 113.1 per 100,000 in men by 2010. These data support the message that MS services should be expanded with more MS nurses, physiotherapy and neuropsychology specialists. In the GPRD study, it was estimated that 126,669 people were living with MS in the UK in 2010 (203.4 per 100,000 population) and that 6,003 new cases were diagnosed that year (9.64 per 100 000/year).
There is no data regarding the cause of death, although a case record reviews about mortality on a retrospective (and also prospective) basis should be performed in the future.
The incidence rate was higher than those observed in the UK (incidence rate: 9.1/100,000 in Mackenzie’s study). It is a noticeable increase in the number of new MS patients diagnosed in the Highlands. This fact cannot be explained completely by a true increase in MS incidence, and it is likely to be better explained by an increase in early diagnosis cases and other factors including better developmental service, easy access to MRI and the establishment of a MS service integrated by several consultant neurologists and MS specialist nurses.
The average age at diagnosis is comparable to that reported in UK (Mackenzie, 2014). The proportion of patients taking DMTs was slightly lower that observed by O’connell in Northern Ireland; there, two thirds of MS patients were on DMTs. However in a British Columbia review from an older cohort (1991-2008) around one third of incident MS patients filled a prescription for MDT within three years of diagnosis (Kingwell, 2015).
The new modified McDonald clinical criteria for the diagnosis of MS have recently been published online in Lancet Neurology in 2018. Patients with a diagnosis of clinical isolated syndrome (CIS) who have positive oligoclonal bands will be considered as having MS according to the new MS diagnostic criteria. This fact may have an impact in the incidence and prevalence data for MS.
There is a lack of information regarding infantile MS. Paediatric cases should be included in prospective incidence and prevalence studies. In the future, it is planned to include prevalence and incidence data for child MS cases in the Highlands.
Further MS prevalence studies in the Highlands should cover all surgeries and GPs in the Highlands. There are some concerns about the fact that MS patients with advanced disease or secondary progressive MS are not followed up routinely at MS clinics, and prevalence could be higher than found. Letters requesting information about MS patients (and MS subtypes) will be sent to all surgeries and GPs in a future MS prevalence project. This will probably give us a more accurate census of the prevalence of MS in the Highlands.
Disability data based on EDSS and other tools such as the MS Impact Scale (MSIS) would be helpful to plan provision of health care and services in the health broadly and on a local level in the communities.
Conclusions
Prevalence and incidence of MS in the Highlands has increased in the last 50 years. This fact may reflects several factors including differences in studies over time, improved diagnostic methods (routine use of MRI and CSF for oligoclonal bands), and also a true increase in prevalence rate due to improved survival, higher incidence rates or a result of migration.
There is an increasing population living longer with MS, and this fact has important implications for resource allocation for MS in the Highlands.
References
- NHS Quality Improvement Scotland (QIS). Neurological Health Services, Clinical Standards October 2009. Available at: www.healthcareimprovementscotland.org/our_work/long_term_conditions/
neurological_health_services/neurological_standards_2009.aspx. - Polman, C et al (2011). Diagnostic criteria for multiple sclerosis: 2010 Revisions to the McDonald criteria available at https://www.ncbi.nlm.nih.gov
- Brown, LD, Cat, TT and DasGupta, A. Interval Estimation for a proportion. Statistical Science 2001; 16:101-133.
- Rothwell PM, Charlton D. High incidence and prevalence of multiple sclerosis in south east Scotland: evidence of a genetic predisposition. J Neurol Neurosurg Psychiatry 1998; 64: 730-735.
- Visser EM, Wilde K, Wilson JF, Yong KK, Counsell CE. A new prevalence study of multiple sclerosis in Orkney, Shetland and Aberdeen city. J Neurol Neurosurg Psychiatry 2012; 83:719-724.
- O’Connell K, Tubridy N, Hutchinson M, McGuigan C. Incidence of multiple sclerosis in the Republic of Ireland: a prospective population-based study. Mult Scler Relat Disord 2017: 13: 75-80.
- Age – Demographics – The Scottish Government. Available at: www.gov.scot/Topics/People/Equality/Equalities/DataGrid/Age/AgePopMig
- Mid-Year Population Estimates Scotland, Mid-2016 Population estimates by sex, age and area Published on 27 April 2017. Available at: https://www.nrscotland.gov.uk/...
- United Nations, Department of Economic and Social Affairs, Population Division (2017). World Population Prospects: The 2017 Revision, custom data acquired via website. Available at: https://esa.un.org/unpd/wpp/
- Mackenzie IS, Morant SV, Bloomfield GA, MacDonald TM, O’Riordan J. Incidence and prevalence of multiple sclerosis in the UK 1990-2010: a descriptive study in the General Practice Research Database. J Neurol Neurosurg Psychiatry 2014; 85:76-84. doi: 10.1136/jnnp-2013-305450.
- Kingwell E, Zhu F, Marrie RA, Fisk JD, Wolfson C, Warren S, et al. High incidence and increasing prevalence of multiple sclerosis in British Columbia, Canada: findings from over two decades (1991-2010). J Neurol 2015; 262:2352-2363.
- Acheson ED. Multiple sclerosis in British Commonwealth countries in the Southern hemisphere. Brit J Prev Soc Med 1961; 15: 118-125.
More MS Academy Service audit Projects

Encouraging excellence, developing leaders, inspiring change
MS Academy was established in 2016 and in that time has accomplished a huge amount with exciting feedback demonstrating delegates feel inspired and energised along their personal and service development journeys. The various different levels of specialist MS training we offer are dedicated to case-based learning and practical application of cutting edge research.